Our
population
Archipel's population and territory
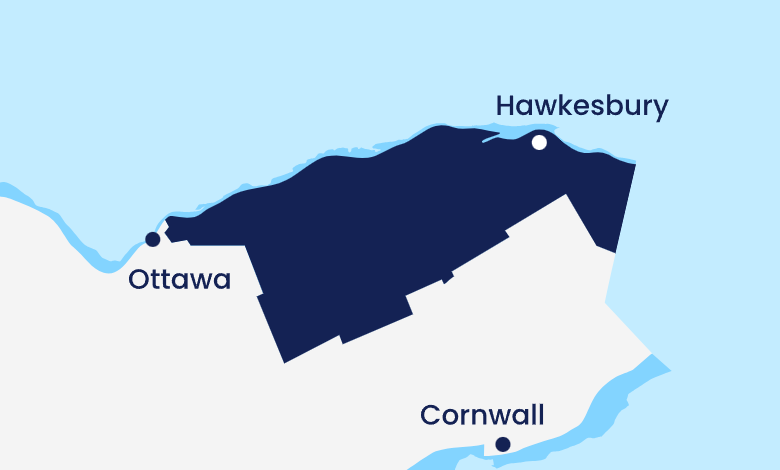
The area covered by Archipel Ontario Health Team (OHT) extends from downtown Ottawa to the Québec border in the east, and from the Ottawa River in the north to the southern border of Prescott-Russel Counties.
Over 200,000 people live in the area served by Archipel. Whether they are residents of the City of Ottawa, small towns and villages in Eastern Ontario, or residents of rural areas in the Eastern Counties, they will benefit from responsive and better coordinated health care and community services through our OHT.
We respectfully acknowledge that we operate on the unceded traditional territory of the Algonquin people. We honour Indigenous peoples, the original inhabitants and stewards of this land, and recognize the importance of understanding their histories, knowledge, relationships with this territory, and current needs, in order to help improve the ways in which people receive the care of their health. We also recognize the value of traditional healing practices and the importance of ensuring they are available as an option for those who seek them. We are committed to strengthening our relationships with Indigenous peoples and to continuing to learn and grow alongside them, valuing their contributions and perspectives.
What is the population of an OHT?
The population of an Ontario Health Team includes the people officially “attributed” or assigned to it using data that reflect networks of hospitals, physicians and their patients.
- Archipel’s population live in a non-official geographic area defined by Ontario Health East. This area includes Ottawa East and the United Counties of Prescott-Russell.
Map of Archipel's territory
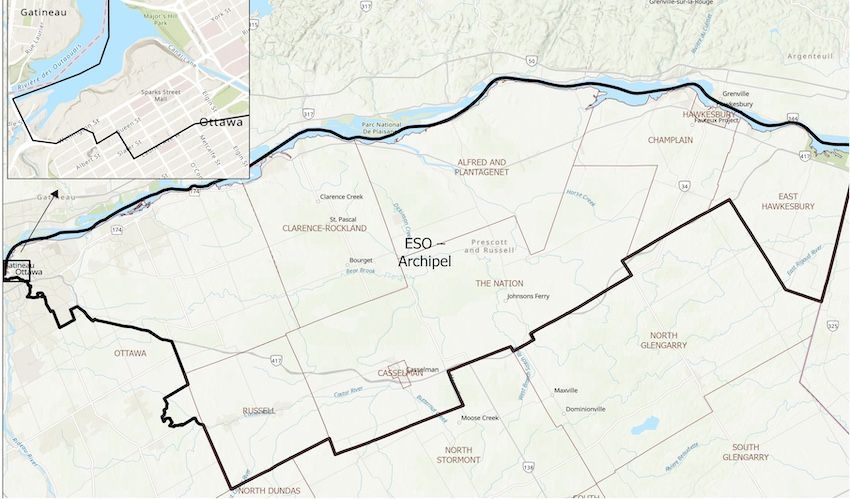
Ottawa East includes Vanier, Lowertown and Orléans, while Prescott-Russell encompasses eight municipalities: Clarence-Rockland, Hawkesbury, Casselman, Alfred-Plantagenet, Champlain, East Hawkesbury, The Nation and Russell.
Population of Archipel by sector
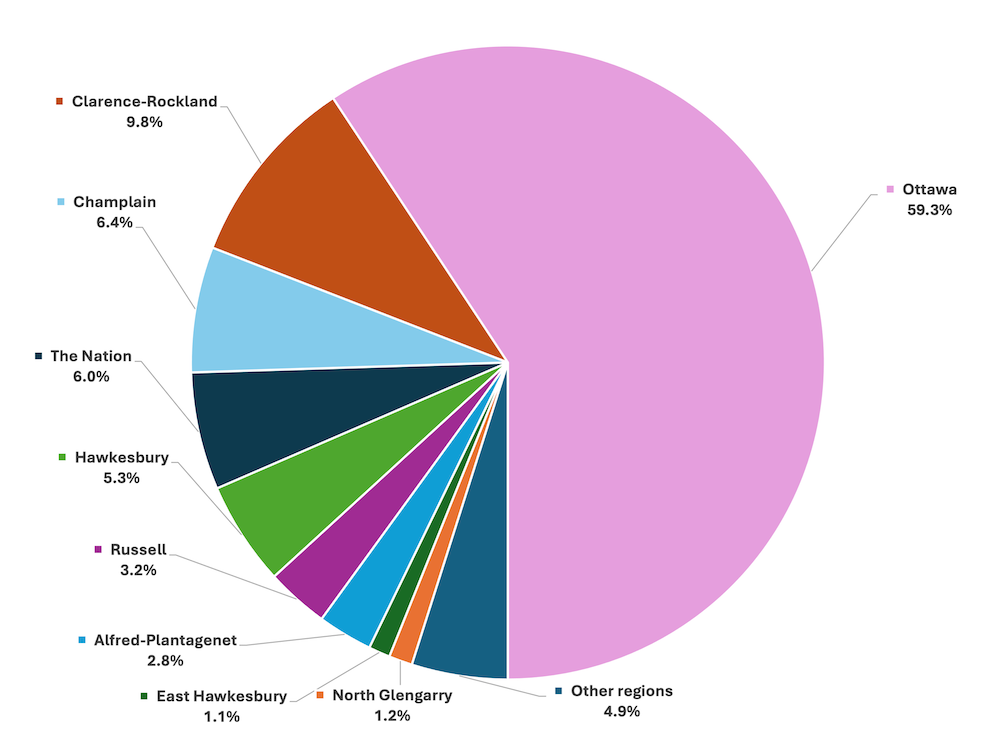
Population data are from 2021
Population data
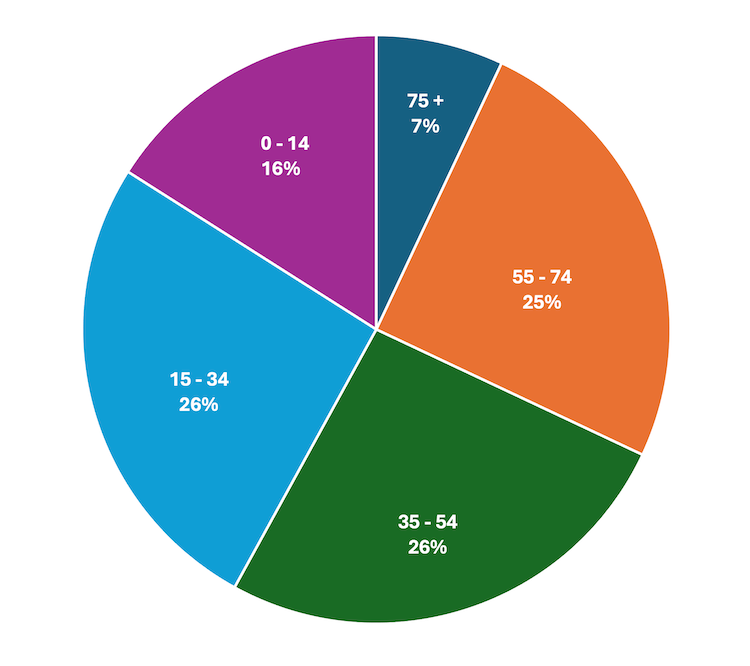
The population data presented below are from 2021.
Age groups of Archipel's population
Mother tongue
- 37 % of the population's mother tongue is French.
- Most common other languages:: Arabic, Spanish and Mandarin.
Origins of the population
- Indigenous identity: 3.5 %
- Black: 10 %
- Arab: 5 %
- South Asian: 3.5 %
- Chinese: 2.1 %
- Immigrants: 20 %
- Recent immigrants*: 6 %
*within 10 years of the 2021 census
- Other visible minorities: 5 %
Socio-economic challenges
Some of our demographics face socio-economic challenges.
- Income: 9.3 % has low income.
- Education: 13 % has no high school, college or university diploma or degree.
- Housing: 27 % has core housing needs.
Representation of the community
In 2025, we established the sociodemographic profile of our active members through a survey. As we strive to build a system that reflects the needs and the diversity of our communities, it is essential that decison-makers also reflect this community. For more information, please consult the article Report on the sociodemographic profile of Archipel’s active members.